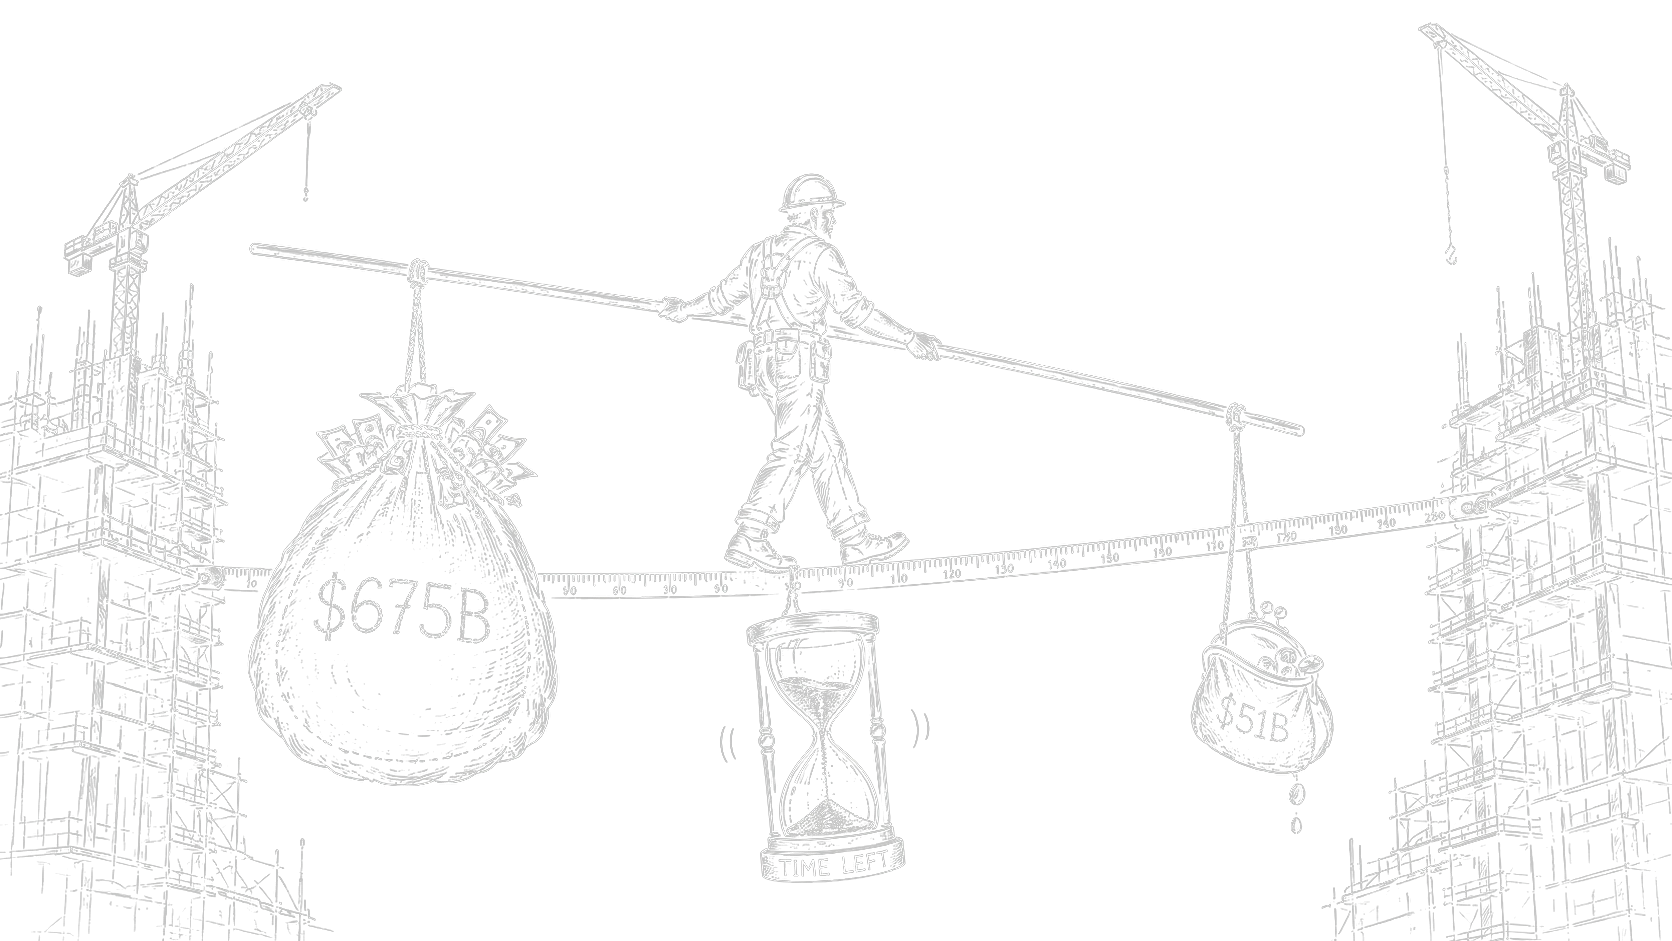
Anatomy of the Number
Amazon is guiding the market to roughly $200 billion in capex for 2026. Alphabet is at $175–185 billion, Meta raised its guidance to $115–145 billion, Microsoft is tracking above $120 billion, and Oracle is around $50 billion. Some analysts — CreditSights among them — had pushed the upper end of their estimates to $700–900 billion by mid-2026.
The mere fact that estimates for the same handful of companies can swing by more than $200 billion tells you how fast these numbers are getting revised upward, quarter after quarter.
The revenue side is where things get genuinely murky, and the murkiness itself is telling. Microsoft is the only one of the five that breaks out a distinct AI-business number: Azure AI is now running at roughly $37 billion a year, up 123% year over year. Amazon and Google don’t do this — they report cloud as a single line (AWS at roughly $150 billion, Google Cloud at roughly $80 billion), where AI is part of the growth story but never gets its own row.
When analysts try to strip out the AI-specific slice from overall cloud revenue, the three companies together land somewhere in the $40–60 billion range — which is where the consensus estimate of roughly $51 billion comes from. That only one company out of five is willing to disclose that number on its own is itself a signal: for the other four, it’s apparently still more useful to let it blend into the broader cloud growth story.

Forecast vs Forecast
A fair question to ask here: how reasonable is it to set 2026’s announced capex against revenue we won’t actually see for several more quarters? Technically, both figures — the $450–500 billion in AI capex and the roughly $51 billion in AI revenue — belong to the same year, 2026, so at least it’s an apples-to-apples comparison across the same calendar year, rather than pitting this year’s spending against last year’s sales.
But a revenue forecast is inherently softer than a capex forecast: companies commit to budgets with far more confidence than they can predict future sales, so one of these two numbers is simply on firmer ground than the other.
To sidestep forecasts altogether, it helps to look at what’s already happened. Capex for the same five companies came in at an actual $256 billion in 2024 and $443 billion in 2025; the AI-specific slice, using the same rough 75%, works out to about $332 billion in 2025. Independent estimates put 2025 AI revenue across the three biggest clouds in the $40–60 billion range.
So even without a single forward-looking number — using only reporting for a year that’s already closed — the ratio comes out to roughly 7–8 to 1. That’s noticeably, if not dramatically, gentler than the 9–10 to 1 projected for 2026. In other words: the gap itself isn’t an artifact of comparing two different forecasts. It shows up in the numbers that have already been reported, and it’s widening year over year, not narrowing.

History Has Seen This Before
Benchmarking today’s capex cycle against a single precedent — 2011-era cloud computing, say, or the dot-com years — is too narrow a lens. Economists have a name for this pattern: the “capital cycle.” A new technology sparks a rush of enthusiasm, capital pours into construction faster than real demand can materialize, overcapacity builds up, and a painful correction follows. This pattern has at least three major historical precedents, each different in scale and character.
The railroad boom. The largest infrastructure capex cycle in history — by some estimates, railroad investment in peak years reached 10–20% of all private investment in the US economy, while Britain’s Railway Mania of the 1840s absorbed more than 7% of the country’s GDP. In the US, more than 33,000 miles of track were laid between 1868 and 1873 alone, a run that ended in the Panic of 1873 and hundreds of bankruptcies.
Andrew Odlyzko, an economist who studies the history of financial manias, describes the collective optimism of those years as “collective hallucinations” — a state in which investors, the public, and the press all stop seeing the risk at the same time. The technology itself turned out to be genuinely transformative for the economy; the first wave of investors simply didn’t profit much from it.
The money went to whoever came later and put the already-built, post-bankruptcy infrastructure to use at a discount — the textbook case being Sears and Standard Oil, both built on the back of cheap logistics.
The telecom boom of 1996–2001. The closest structural parallel to AI: capex poured into physical infrastructure ahead of traffic that hadn’t arrived yet. After the Telecommunications Act of 1996, the industry spent more than $500 billion, mostly on debt, laying fiber and building switches; the annual pace of capex rose from $62 billion in 1996 to a peak of roughly $135 billion in 2000.
The justification was WorldCom’s claim that internet traffic was doubling every hundred days — later shown to be closer to myth than measured fact, but it was exactly the assumption that demand forecasts were built on. Revenue at the new entrants (the CLECs) grew from $5 billion to $43 billion over the same stretch — an 8.6x increase, genuinely fast — and still ended up a fraction of the capex.
By 2001–2002, a 90% collapse in bandwidth prices and roughly 85% unlit, so-called “dark fiber” sank the sector: the Nasdaq telecom index fell 92% and, 25 years later, still hasn’t recovered. In the long run, though, that same dark fiber — sitting untouched for years — became the backbone of cheap 2000s broadband, and the substrate Netflix and streaming in general were built on.
Shale oil, 2010–2020 — a non-tech example. To show this isn’t a uniquely “tech” pattern: thirty North American shale producers spent a combined $913 billion in capex over the decade while posting a combined negative free cash flow of $226 billion. In 2014–2015, oversupply crashed oil prices from $110 to $35 a barrel; the Russell 2000 energy index returned –63% for the decade, and according to the law firm Haynes and Boone, more than 600 companies filed for bankruptcy.
Same capital cycle, minus the “new era” narrative — just overbuilding against an overly optimistic demand forecast.

Measured directly, as a share of US GDP in the peak year: the railroad mania of the 1880s comes in around 6%, AI data centers in 2025 around 1.2%, and the telecom boom of the early 2000s around 1%. The current AI cycle is already the third-largest infrastructure capex cycle in US history relative to the size of the economy — and it’s still growing.
The general pattern across capital cycles is this: it’s rarely the technology’s end users who lose money on the construction — it’s the builders, the first wave of investors. The value goes to whoever arrives second and puts the already-devalued, oversupplied infrastructure to work without having taken on the risk of building it.
What the Argument Misses
There are two competing scenarios for how the gap between AI capex and AI revenue could close — and they imply very different speeds.
The first is the Jevons paradox: the cheaper a resource gets, the more of it gets consumed, not less. The price per token of inference has fallen by an order of magnitude over the past two years, while corporate spending on generative AI over the same period has grown roughly twentyfold.
That’s essentially what Satya Nadella meant when, after Nvidia’s stock sold off on the DeepSeek news, he wrote that AI becoming more efficient and more accessible would drive an explosion in usage rather than a decline — and the market did eventually claw back that drop. If this effect keeps working at the same pace, the gap closes through volume, not through price per unit.
But there’s a wrinkle here. Research cited by Gartner suggests the Jevons paradox plays out differently for commodity inference than for frontier models. Cheap, “yesterday’s” models genuinely are racing toward zero cost — they’ll run on almost anything. Access to the most powerful models, meanwhile, remains scarce in practice: some frontier providers are already capping usage simply because they can’t serve all demand at a cost that’s close to zero.
It isn’t all of AI that’s getting cheaper — it’s yesterday’s AI.
And that bottleneck isn’t the chip itself. The real constraint sits further down the supply chain: HBM memory, advanced chip packaging, and the power grid. McKinsey estimates that data centers will need an additional 130–240 gigawatts of capacity by 2030, and the lead time on a large substation transformer has stretched from 24–30 months to five years.
Which leads to the central argument here: the gap itself isn’t a verdict of “bubble” or “not a bubble.” It’s a bet on timing. If demand grows in step with cheaper commodity inference faster than physical infrastructure can expand, the gap closes through revenue. If it’s the other way around — and multi-year queues for substations and transformers suggest it is — some of the capital already committed won’t find demand in time, and will have to be written off sooner than planned.

Who Feels It First if the Bet Doesn’t Pay Off
If the pain comes, it won’t be spread evenly. The hyperscalers still have strong balance sheets: the liabilities-to-assets ratio for the top five sits around 48%, close to 2015 levels. But credit markets are already pricing this selectively — five-year CDS on Oracle, which carries the highest single-customer concentration risk of any hyperscaler (OpenAI) and the most debt-fueled growth model among them, have more than tripled since September.
Neoclouds like CoreWeave and Nebius — operators that lease out GPU fleets against specific contracts — have an even thinner cushion: tens of billions of dollars in contracted backlog sit right next to operating losses today.
In the next installments of this series: a deep dive into the economics of the hardware itself and depreciation; how this buildout is actually being financed and where the risk hides; and, at the end, whether — taken together — this all adds up to a bubble, and if so, by what criteria.